แนวโน้ม
Bitcoin Rainbow Price Chart
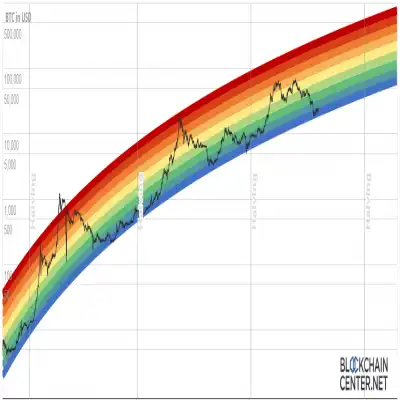
Rainbow Chart is a long-term valuation tool for Bitcoin. It uses a logarithmic growth curve to predict the potential future price direction of Bitcoin.
The Rainbow Chart is intended to be a fun way to look at long-term price movements while ignoring the daily volatility "noise". The color bands follow a logarithmic regression (introduced by Bitcointalk User trolololo in 2014), but otherwise they are completely arbitrary and have no scientific basis.Maximum Bubble Zone Sale. Seriously, BUY! FOMO condenses Is this a bubble? HODL! Buy still cheap Savings It is a robust charting system that works for buying or selling by color.

Wrapped Bitcoin
You can easily buy Wrapped Bitcoin tokens on Uniswap. -- of this token were produced. It u...
ราคา
117,300,542964870มูลค่าตลาด
13,985,285,832จำนวนเหรียญทั้งหมด
0