แนวโน้ม
Bitcoin: Days Since X% Drawdown
This chart shows the days since price is down a given percentage. The reference point against which the percentage drawdown is measured is displayed on the chart with yellow dots. This reference point is determined by the highest price since the most recent percentage decline of the specified decline amount occurred.
You can customize the percentage decline amount in the options above the chart. The moving average for this chart gets applied to the price instead of the metric. For example, selecting a 7D SMA and 30% decline shows the amount of days since the 7D SMA of the price has declined 30%.
Into The Cryptoverse Premium SALE:
https://intothecryptoverse.com
Into The Cryptoverse Newsletter:
https://newsletter.intothecryptoverse.com/
LIFETIME OPTION:
https://intothecryptoverse.com/product/subscription-to-the-premium-list-lifetime/
Alternative Option:
https://www.patreon.com/intothecryptoverse
Merch:
https://store.intothecryptoverse.com/
Disclaimer: The information presented wi

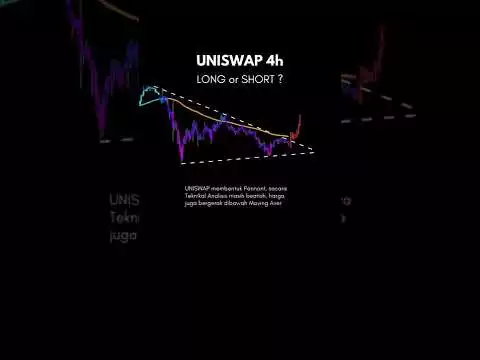
Wrapped Bitcoin
You can easily buy Wrapped Bitcoin tokens on Uniswap. -- of this token were produced. It u...
ราคา
63,488,780926640มูลค่าตลาด
9,350,230,530จำนวนเหรียญทั้งหมด
0